Skip to content
Background & Summary
Given that China spans more than 9.6 million square kilometres, many of its highest-level administration divisions (e.g., provinces, autonomous regions, municipalities, and special administrative regions) are very large in their area and population. A large province comprises many cities with vast variations in their economic structures and development levels. For example, Guangdong, the province with highest gross domestic product (GDP) in China, contributes more than 10% of the GDP of China. Its GDP per capita and the human development index are both very high among China’s provinces. However, the GDP and other development indicators of its cities vary significantly. Guangzhou and Shen Zhen, the two largest cities among the 21 prefecture-level cities of Guangdong, jointly account for nearly half of the total GDP of the province. The nine cities of Guangdong in the Pearl River Delta (PRD), including Guangzhou and Shenzhen, contribute more than 80% of Guangdong’s total GDP, whereas the five least developed cities in the province only contribute less than 5% of its GDP1. The Gini coefficients estimated from GDP per capita show that the differences between-city in Guangdong, ranging from 0.33 to 0.42, which are much higher than those between-province from 0.03 to 0.22 during 2002–2017. To capture the intermediate and final product supply and demand linkages among these high diverse cities across the mainland of China, the large-scale high-resolution inter-city input-output (IO) table is needed to reflect detailed economic heterogeneities across cities.
In addition to the significant heterogeneity across cities within the mainland of China, the linkage of special administrative regions and Taiwan to the mainland of China is also noteworthy, as these regions differ substantially from mainland cities in terms of institution framework, structure of economy, as well as their roles in global value chains (GVC). For this reason, we also attempt to include these regions as a part of our IO tables so that to allow the analysis of the linkage between them and the mainland.
Hong Kong, Macao, and Taiwan can also be categorized into two groups based on the way they link the mainland of China to the international market. Hong Kong and Macao focused on the superior port system and aviation hub2, international financial and trade centres, and modern services. They belong to the Greater Bay Area (henceforth GBA), an integrated area of South China that includes nine cities of Guangdong Province in the Pearl River Delta, along with Hong Kong and Macao3. The GBA is one of China’s most dynamic urban agglomerations, characterized by its high degree of openness and dynamics of economic activities. In 2022, the GBA contributed more than 10% of China’s total national GDP (13.04 trillion CNY, around US $ 1.94 trillion)4,5,6, and it has long been recognized as one of the critical geographic areas to understand the linkage between China’s domestic supply chains and China’s participation in global production network. Therefore, incorporating Hong Kong and Macao into China’s city-level IO tables provides the international research community with a valuable database to study what roles the GBA could play in East Asia and the global economy.
Taiwan’s economic linkage to mainland China is somehow different from that of Hong Kong and Macao, as it relies more on foreign direct investment (FDI). Since the 1980s, Taiwan has maintained very close direct economic linkages with the mainland in addition to its indirect linkage to the mainland through Hong Kong and Macao, and it has been one of the major sources of FDI in the mainland of China. As of the end of 2020, Taiwan had invested a total of 70 billion US dollars, accounting for 3.1 per cent of total FDI in mainland China and it had established more than 117 thousand factories (11.2% of the total) in the mainland7. The key industrial linkage between mainland China and Taiwan is manufacturing. Taiwan has transferred its traditional labour-intensive manufacturing and electronic industries into many prefectural cities in the mainland such as Zhengzhou and Xi’an. Furthermore, Taiwan’s investment and manufacturing activities in the mainland are usually concentrated in export-oriented sectors, i.e., sectors that mainly participate in international market through vertical FDI and specialisation in the global supply chains8. To help the international research community capture the important roles of Taiwan in China’s domestic supply chains and the East Asian and global supply chains, we also integrate its IO tables into our inter-city IO database.
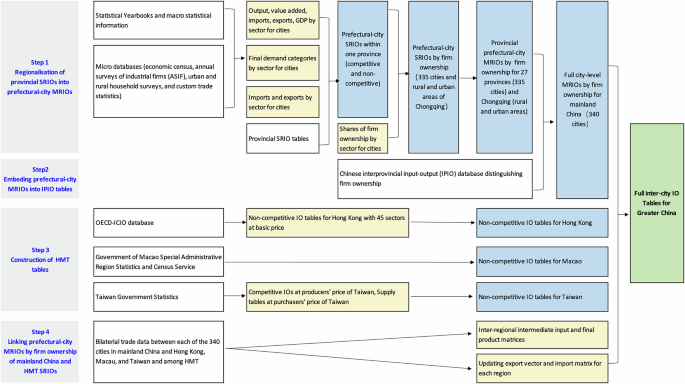
From the methodology perspective, the product-mix problem in sectoral/regional aggregation at different levels are the most crucial issue facing the IO communities. Compiling an IO table is usually based on the assumption of homogeneous products9,10. However, the product-mix problem in IO tables originates from firms in the same sector that produce different sets of products through heterogeneous technologies11. This aggregation issue can be more severe in multi-region input-output (MRIO) tables, which have been acknowledged as suitable databases to quantify the economic interdependence among industries in different economic regions11. MRIO databases have been developed at global12,13,14,15,16,17,18,19,20,21, national22,23,24,25,26,27, and subnational28,29,30,31 levels and applied to economic, social and environmental issues such as value-added trade32,33, employment34 and inequality35, as well as GHG emissions36 and carbon footprint estimation37. A variety of Chinese subnational MRIO tables have been constructed by different research groups38,39,40,41,42,43,44,45,46,47,48 and are widely used in the research communities49,50,51,52,53. Most previous subnational MRIOs for China use commodity sectors for their table construction41,43,44,45,54 and, therefore, cannot avoid the aggregation bias caused by the product-mix issue. Some studies have considered the heterogeneity of production technologies by different types of firms55,56,57. One stream of firm heterogeneity treatments is from the global production perspective, which separates processing and normal trading firms58,59,60,61. The other is from a domestic perspective, which distinguishes foreign-invested enterprises (FIEs) from Chinese-owned enterprises (COEs)62,63. A recent paper published further distinguishes FIEs into Hong Kong, Macao, and Taiwan (HMT) invested enterprises and other FIEs8 to capture special features of China’s FDI64. These efforts somewhat reduced the product-mix problem, but most of these studies were conducted at the national or provincial level. To the best of our knowledge, no Chinese city-level IO tables have incorporated any firm heterogeneity information. This paper is the first effort to fill this gap.
Several city-level MRIO tables have been developed for mainland China using either bottom-up or top-down methods. For instance, the city-level MRIO tables for Jing-Jin-Ji urban agglomeration are constructed based on 11 prefectural-city single region input-output (SRIO) tables of Hebei and those of Beijing and Tianjin31,65. Such a bottom-up method uses SRIO tables for different cities compiled from survey methods as the domestic transaction matrices. This approach allows one to reliably disaggregates city trade by sector to form inter-city transaction matrices. However, such an approach is very costly and often hampered by a lack of data because statistical agencies in most cities usually do not compile IO tables. As a result, the top-down approach, i.e., a non-survey mathematics-based proportional method, is widely used in inter-city IO table construction. It is often carried out through commodity balance (CB) or location quotient (LQ) methods. For example, due to the absence of updated survey-based city-level SRIO tables, the inter-city IO table for 11 prefecture-cities of Hebei for 2012 was updated using an entropy-based CB method66. Such a method is also used to create MRIO tables covering about 300 Chinese cities and four provinces (Qinghai, Yunnan, Hainan, and Tibet) for mainland China in the years 2012, 2015, and 2017, and is also applied to a 41-city table in the Yangtze River Delta city cluster67. The Industrial Ecology Virtual Laboratory (IELab) constructed another Jing-Jin-Ji inter-city table using Flegg’s LQ method68. It attempts to construct a flexible compilation methodology for subnational MRIO tables based on non-survey methods by splitting the national IO tables of China30. This approach is further used to create a provincial-city MRIO table for ten major cities in China and a GBA MRIO table for nine prefecture cities in the Pearl River Delta, linking with IO tables of Hong Kong and Macao extracted from the global MRIO database EORA69. The details of all published Chinese subnational MRIO databases at city levels are shown in Table 1. None of them covered the complete prefectural-level cities in mainland China and integrated Hong Kong, Macao, and Taiwan. To address this gap, this study attempts to reconcile all accessible micro-level data from various sources with city and provincial-level aggregate statistics to compile the first complete inter-city IO database for the Greater China area.
Table 1 The list of Chinese subnational MRIO databases at city levels.
Compared with previous work, our database introduces two methodological innovations for compiling inter-city IO tables. The first major methodological innovation is that the database adopts a combination of bottom-up and top-down methods to estimate the structure of the inter-city IO tables. A variety of microdata is used to estimate the economic structure of each covered city, including economic census, annual surveys of industrial firms (ASIF), urban and rural household surveys, and product level custom trade statistics. From the bottom-up perspective, these micro-level data are aggregated to obtain structural estimates at the sectoral level for each city. For every prefectural-level city, both economic census and ASIF are used to estimate industrial sector structure of gross output and value added, urban and rural household surveys provide the structure of household consumption expenditure by major categories in final demand, and detailed custom trade statistics inform the product structure of imports/exports. The database further combines the structure estimates from microdata with China’s provincial and city-level aggregate statistics as constraints to provide more precise structural shares for intermediate inputs of production, consumption of final demand, and trade flow at the city level. From the top-down perspective, the database regionalizes provincial IO tables into city IO tables with the bottom-up structure estimates constrained by GDP of cities to obtain estimates of the row and columns controls for the city IO tables. The use of such rich micro-level data significantly improve the accuracy and quality of the structural estimate of the constructed IO tables at the city level. Furthermore, each sector-city pair is further split by firm ownership using the data of firm’s registration types and realized capital structures from economic census and ASIF. The firm-level data are aggregated into the three major ownership groups and compiled to be consistent with provincial IO sector classifications. This also applies a bottom-up and top-down combination process to reduce the “aggregation error” come from the product-mix problem in the IO compilation process.
Overall, such a combined bottom-up and top-down compilation approach based on various micro-level and macro-level data, not only can help others to develop the inter-city IO tables with treatments of firm heterogeneity that meets the needs of their research, but also facilitates efficient workflows for the benchmark year of 2023. Starting from benchmark year 2023, the fifth China Economic Census and the eighth China Input-Output Survey have been integrated into one, and the advent of detailed and consistent data based on such a joint work can be easily utilized for the future city-level MRIO compilations based on our methodology, which focus on reconciling different sources of data at different levels.
The second key methodological innovation is that the database applies a three-tier data architecture to organize the compilation of the inter-city IO tables. The first tier is the raw data for further processing, which stores enormous micro and macro data from various sources. The second tier is the derived data sets for the inter-city IO table compilation, including processed data at the city level from the first tier to estimate both the sector and firm ownership structure for each prefectural city. Aggregated statistics such as provincial input-output tables and GDP estimated by production, income, and expenditure methods are used as constraints to reconcile these data sets derived from micro data. In this stage, three intermediate data products are generated, which can be applied to various research topics: (1) prefectural-city SRIO tables by firm ownership for each province (335 prefectural-city SRIOs and urban and suburb SRIOs of Chongqing, total of 337 SRIOs); (2) provincial-wide prefectural-city MRIOs by firm ownership for 27 provinces and Chongqing; (3) full city-level MRIOs for mainland China (total of 340 cities, more details can be found in Supplementary Table 1). The third tier is the final inter-city IO tables, i.e., the ownership-based inter-city IO tables, including the HMT region for the four benchmark years.
After introducing the main methodological innovations of our database. Now we describe the three important features of the constructed city-level IO tables: First, the database is one of the largest-scale inter-city IO tables in the world to date. It contains all above-prefectural cities in the Greater China area with 335 prefecture-level cities from 27 provinces, four municipalities directly under the Central Government (i.e., Beijing, Shanghai, Tianjin, and Chongqing with separate urban and suburb regions, subtotal of five regions in the table) in mainland China, and Hong Kong, Macao and Taiwan (HMT), a total of 343 regions. Furthermore, it is the first time that benchmark SRIOs for Macao have been constructed, and benchmark years and sector classifications for IO tables from Hong Kong and Taiwan have been harmonised with SRIO tables of mainland China.