
Trading cryptocurrency and blockchain-based assets can seem complicated at first, but with the right tools and knowledge, you can navigate this exciting market confidently. One of the most useful tools for crypto traders is technical analysis—a method of studying charts, patterns, and data to make informed trading decisions.
If you’ve ever wondered what terms like RSI, candlesticks, or moving averages mean, this glossary is for you! We’ll break down essential technical analysis terms to help you understand how traders analyze markets and make smarter decisions. By the end, you’ll have exposure to 10 terms commonly found in technical analysis with the goal to motivate you to start exploring this field of study borrowed from TradFi and applicable to digital assets in the new Web 3.0 world. And if you’re as passionate about blockchain and Web3 as we are, make sure to subscribe to Web3Wonders.US for more in-depth guides and insights!
Important note: Not financial advice, this blog is simply providing information to motivate you to learn. Always consult with a financial and/or tax advisor and always look for confluence on any research. Assume every link, every offer is a scam and do your own research. Listen, learn, explore and always be skeptical. Know your tax consequences, know your exit strategy and never invest what you cannot afford.
What Is Technical Analysis?
Technical analysis is a way of predicting the future price movements of an asset by studying past market data, like price charts and trading volume. Traders use this method to identify trends, potential reversals, and opportunities for buying or selling.
Fundamental Analysis in TradFi is a method used in Traditional Finance (TradFi) to evaluate the intrinsic value of an asset by analyzing underlying factors such as:
financial metrics,
economic indicators,
industry trends and
company-specific factors.
Technical Analysis is a method to evaluate future price movements of assets by analyzing:
Historical price data,
trading volume,
market patterns,
trends and trendlines, and
support and resistance levels along with technical indicators.
Volumen analysis and candlestick patterns
Unlike fundamental analysis, which focuses on an asset’s real-world value (such as the technology behind a cryptocurrency), technical analysis is all about patterns, numbers, and behavior in the market. While it doesn’t guarantee outcomes, it can help traders make better-informed decisions.
Glossary of Technical Analysis Terms
Let’s dive into the key terms you need to know:
1. Relative Strength Index (RSI)
RSI is a tool that measures the strength of an asset’s price movement on a scale of 0 to 100.
How It’s Used: Traders use RSI to identify whether an asset is overbought (above 70) or oversold (below 30). Overbought assets may experience a price drop, while oversold assets might see a rebound.
2. Moving Average (MA)
A moving average is the average price of an asset over a specific period, such as 10, 50, or 200 days.
How It’s Used: It helps traders identify trends. If the price is above the MA, the asset may be in an upward trend. If it’s below, the trend might be downward.
3. Candlestick Patterns
Candlesticks are visual representations of price movements during a specific time frame, such as 1 hour, 1 day, or 1 week.
How They’re Used: Patterns like “Doji,” “Hammer,” or “Bullish Engulfing” can signal potential reversals or continuation of a trend.
4. Support and Resistance Levels
Support is a price level where demand is expected to prevent further declines. Resistance is a level where supply is expected to prevent further increases.
How They’re Used: Traders watch these levels to predict where prices might bounce or break through.
5. Volume
Volume refers to the total amount of an asset that has been traded during a specific period.
How It’s Used: High volume during a price increase may confirm a trend, while low volume could signal weakness.
6. Fibonacci Retracement
This tool uses mathematical ratios to identify potential support and resistance levels based on an asset’s recent price movements.
How It’s Used: Common ratios include 23.6%, 38.2%, 50%, and 61.8%. These levels help traders predict where prices might reverse.
7. Bollinger Bands
Bollinger Bands are lines plotted two standard deviations away from a moving average.
How They’re Used: They show whether an asset’s price is high or low relative to its recent history. Prices near the upper band might be overbought, while prices near the lower band could be oversold.
8. MACD (Moving Average Convergence Divergence)
MACD is a tool that shows the relationship between two moving averages.
How It’s Used: Traders use MACD to identify trend changes and momentum. Crossovers between the “signal line” and MACD line are key signals.
9. Trend Lines
Trend lines are straight lines drawn on a price chart to connect highs or lows.
How They’re Used: They help visualize the overall direction of the market and potential breakout points.
10. Chart Patterns
Chart patterns are shapes that form on price charts, such as triangles, head and shoulders, or double tops.
How They’re Used: Each pattern has specific implications for price direction, either signaling continuation or reversal.
Applying Technical Analysis in Crypto aka Digital Asset Trading
Understanding these terms is just the beginning. Here’s how you can apply technical analysis:
-
- Identify Trends: Use moving averages and trend lines to see whether the market is bullish (upward) or bearish (downward).
- Spot Opportunities: Check RSI and Bollinger Bands to find overbought or oversold assets.
- Confirm Signals: Look at candlestick patterns and chart formations to verify price movements.
- Manage Risk: Use support and resistance levels to decide entry and exit points for trades.
Technical analysis is like a toolbox—you can combine multiple tools to create a strategy tailored to your goals.
Common Mistakes to Avoid
Even experienced traders make mistakes. Here’s what to watch out for:
Overcomplicating Charts: Using too many indicators can create confusion. Focus on a few tools that work for you.
Ignoring Volume: Price movement without volume can be misleading. Always check trading activity
Moon Bag = a portion of an investor’s holdings in digital assets that is set aside and held long-term with the expectation of significant price appreciation, often described going to the moon.
The term reflects a stagey where investor sells a portion of of their holdings to secure projects but retain a smaller bag for potential future gains if the asset’s value skyrockets.
Not Managing Risk: Always set stop-loss orders to limit losses and protect your investments.
Know your Exit Strategy: Mom always stated you never go broke taking a profit and Wendy O. always guides you to know what a moon bag is and manage those funds strategically.
Why Technical Analysis Matters in Blockchain Trading
The digital asset market is highly volatile, with prices often swinging dramatically within hours or days. Technical analysis provides traders with a way to navigate this unpredictability by identifying patterns and trends.
Whether you’re day trading, swing trading or investing for the long term, understanding technical analysis can help you make smarter decisions and reduce emotional trading.
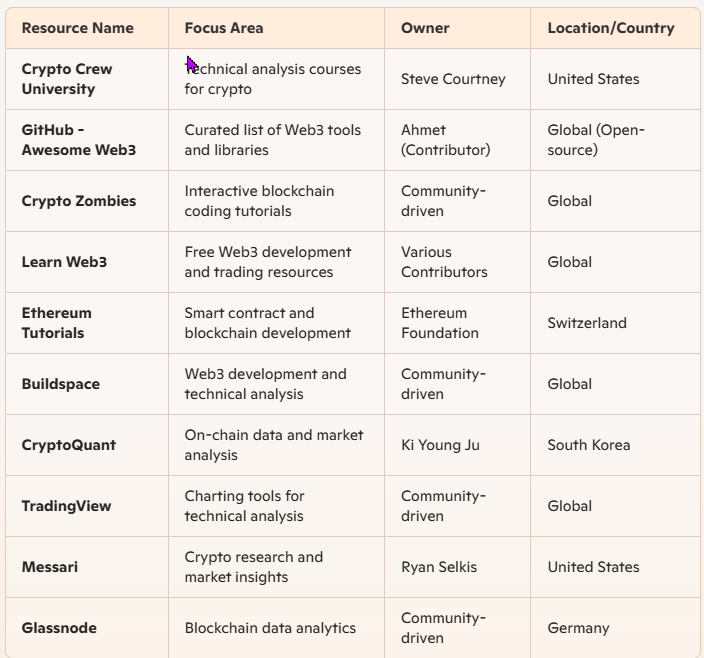
Resources
To help us on our journey, here are some resources with a mix of technical analysis tools, educational content, and blockchain development insights.
Call to Action
Ready to level up your trading skills? Subscribe to Web3Wonders.US today!
At Web3 Wonders, we’re dedicated to empowering blockchain traders and Web3 enthusiasts with in-depth guides, tutorials, and case studies. Stay ahead of the curve with expert knowledge, do your own research and always remember to look for confluence when trading.
Subscribe now and join the Web3 movement! 🚀
Disclaimer: NOT Financial Advise
Listen up, Web3 warriors! Diving into digital asset investing – whether it’s snagging some ADA, riding the Link oracle wave or chasing ETH dreams – is like exploring a cosmic jungle of centralized possibilities. But hold your spacesuits! This info is NOT financial advice. WE’re just biting in the Web3 universe, sharing knowledge for your intergalactic journey not steering your rocket ship.
Web3 is all about empowerment – taking the helm of your data, identify and finance like a true sovereign caption, It’s you, your wallet and your private keys (because, you know not your keys, not your coins! ), With great power comes great responsibility, so do your own research (DYOR), channel your inner detective, and navigate the blockchain frontier with caution and curiosity Price can moon or crater, scams lurk like space pirates and lockup periods might test your patience, Consult a financial advisor before blasting off, and only invest what you’re ready to stake in this wild, decentralized universe.
Embrace the Web3 ethos, own your sovereignty. No financial advisors were harmed in the making of this disclaimer.